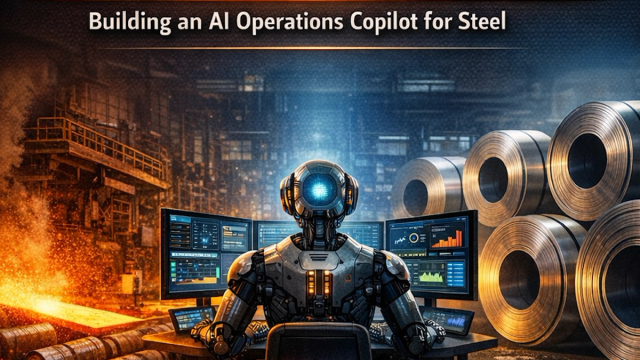
How we built a full-scale, AI-powered industrial planning system — with a live dashboard, real optimisation engine, and 335 automated tests — in two days of conversation with Claude.
Let me tell you about the project that permanently changed how I think about software development.
A few weeks ago, I had an idea: could we build a real, production-grade planning system for a steel mill — the kind of system that normally takes a team of engineers six months to deliver — using only conversations with an AI? Not a toy. Not a demo. Not a mockup with fake data. A real working system.
Forty-eight hours later, we had one.
"The old way: spend weeks building a prototype to show the customer. The new way: build the real thing faster than the prototype would have taken."
This is the story of how we got there — and why it matters for every person in tech, business, and beyond.
The Old Way of Building Software
For decades, software development followed a predictable rhythm. A customer comes to you with an idea. You spend weeks — sometimes months — just figuring out what to build. Then you build a prototype. A static thing. Screens with fake data, no real logic, just enough to show the customer what it might feel like.

The prototype gets shown to the customer. They give feedback. The team goes back and redesigns. The customer waits again. By the time real code is being written, months have passed, and the market has moved.
And the worst part? The prototype itself is a lie. It's a painted wall — it looks like a door but leads nowhere. The customer can't touch real data with it. They can't run it. They have to imagine what the real thing would feel like.
Our Starting Point: A Half-Formed Idea
The project I had in mind was a Slitting Pattern Optimiser for steel manufacturing. Steel mills receive huge mother coils of steel — imagine a roll of paper towels, but each one weighs 20 tonnes and costs tens of thousands of dollars. These coils need to be slit (cut lengthwise) into narrower strips to fulfil customer orders. The cutting pattern matters enormously: waste even 3% of steel on every coil and you lose millions per year.
I came to Claude with an idea that was roughly this vague (this is what was in my mind)
"I want to build a steel mill slitting pattern optimizer using AI. It should help planners decide how to cut mother coils to fulfill customer orders with minimum scrap."
Thirty words. That's it. In the old world, this would kick off a multi-week "discovery phase" with workshops, user interviews, and requirements documents. Instead, what happened next took about four minutes. Claude generated a detailed (yet not fully elaborated, I must admit) prompt like this:
How AI Turned 30 Words into a Product Specification
The prompt was good enough to start our journey!

The AI didn't just respond to what I asked — it anticipated what I hadn't asked. It knew that a steel mill optimiser would need grade substitution rules (a higher-grade steel can serve a lower-grade order, but not vice versa). It knew about remnant management (the leftover strips after slitting). It proposed confidence scoring so the system could route decisions to a human when it was uncertain. None of that was in my 30-word brief.
This is the first paradigm shift: AI doesn't just take instructions — it brings domain knowledge to the conversation.
Building It Together: Feature by Feature
I captured the context in detail in a Requirements Document. Once we had finalised the requirements document, we started building. Not sketching. Not wireframing. Actually building. Here is the complete journey, compressed into a single timeline:

What We Actually Built
The numbers tell the story better than words.

But raw numbers don't capture the depth. Here is what the system actually does:


The Paradigm That Has Permanently Changed
The most important thing about this project isn't the steel mill. It's what it proves about how software gets built now. Let me put it directly side by side:


But What About the Human?
The most common question I get when I share this story is: "So you just… talked to it?" And the answer is: yes, but that undersells the role of the human enormously.
Every decision that mattered was mine. When AI proposed a grade substitution algorithm, I reviewed the metallurgical logic and caught a nuance about stainless steel families that needed correction. When the confidence-scoring formula was proposed, I adjusted the weights. When the UI was built, I reviewed every screen and asked for changes. When bugs appeared — and they did — I understood what was wrong and directed the fix.

The other thing that surprised me:AI makes you a better thinker.When you have a collaborator who can immediately implement whatever you propose, you start thinking harder about what to propose. I found myself asking questions I would never have bothered with before, because the cost of exploring them was effectively zero.
The Takeaway for Everyone in Technology
If you are a business leader, the budget you've been allocating for six-month software projects may need to be reconsidered. Not because the work is less valuable, but because it now costs a fraction as much to do it properly.
If you are a developer, the most valuable skill you can build right now is learning to direct AI effectively. Not to use it for simple tasks, but to collaborate with it on complex ones. The developers who will thrive are those who can hold an entire system's architecture in their head and guide AI through building it piece by piece.
If you are a domain expert in any field — manufacturing, logistics, finance, healthcare —you now have access to engineering capability that was previously only available to companies with large development teams. Your domain knowledge, combined with AI's implementation speed, is a competitive advantage that didn't exist two years ago.
"The prototype is dead. The real thing takes less time to build."
We built a system that a traditional team of four engineers would have taken six months to deliver. We built it in 48 hours of conversation. It has 335 tests, a live dashboard, a mathematical optimiser, a visual cutting diagram, and a complete API with documentation.


And we're just getting started.
My Honest & Humble Submission
Building the future of industrial planning, one conversation at a time. After all these years of building knowledge and experience, I’m convinced that what we once accepted as fixed development timelines is now being reimagined.
#ArtificialIntelligence #SteelIndustry #SoftwareDevelopment #DigitalTransformation #AI #Innovation #Manufacturing #Claude #ProductDevelopment #FutureOfWork